Microservices are the most popular design concept for software architecture in recent years, which forms the technical basis of cloud native together with containers and DevOps. Microservices originate from the market demand for rapid product delivery, which, by implementing agile development practices such as automated tests and continuous integration, can activate organizational efficiency and enhance software reusability, effectively paving the way for middle-end construction, bringing technological dividends to a large number of domestic and foreign Internet companies.
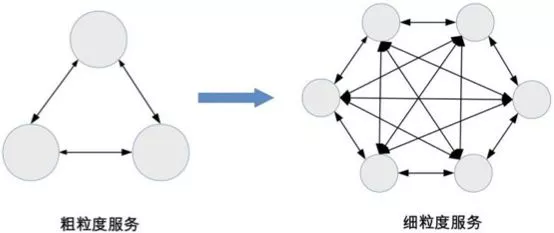
However, the introduced microservices architectures failed to produce desired effect in many enterprises. This can be explained by the second law of thermodynamics – an isolated system is bound to evolve towards entropy increase, that is, it will become more and more complex. Excessive service segmentation can simplify individual services, but exponentially increase the complexity of the entire system. Theoretically, the complexity of n services is n×(n-1)/2. Microservices shift the intra-system complexity to the intersystem complexity, throwing teams into chaos and slowing down delivery.
How to get rid of the dilemma of “entropy increase” and truly enjoy the dividends brought by microservices? On the one hand, we should match the organizational architecture with the software architecture by using a series of DevOPS tools and methods, so that we can use the new technology to our advantage rather than being enslaved by tools. On the other hand, we should introduce an omniscient and omnipotent perspective in the field of operation and maintenance, that is, we can employ the distributed full-link tracking technology to fully control the call relationship between microservices.
JD Cloud SGM (Service Governance And Monitoring) product has been serving the data analysis and query of JD’s trillion-level call chain every day, safeguarding the peak traffic during “618” and “11.11” shopping festivals, ensuring that all transactions are traceable, and all faults can be detected, and featuring extremely high stability and extremely low resource consumption. The financial sector has always been the spearhead in introducing IT technology. JD Cloud has delivered numerous SGM products and practices to a large number of banks and consumer finance companies in the industry, empowering the digital transformation of the financial sector with good results. However, the user experience of certain customers is not satisfactory. The reasons are twofold. On the one hand, this is due to the limited technical environment of users, especially traditional financial customers whose technology stacks focus on monadic applications. These users have many closed commercial software products, and their control over the application of products is relatively low. In contrast, the application effect is better in the consumer finance field with Internet-biased technology stacks. In addition to the constraints of the technical environment, one the other hand, the reason lies in whether the organization has the basic ability to build a full set of monitoring system and the cognitive degree of the whole monitoring system. Any monitoring product can only address a certain aspect of the monitoring system, not the whole, because all single monitoring products have blind spots and limitations. For example, it is unrealistic to expect Network Performance Monitor (NPM) monitoring to be as flexible as Application Performance Monitor (APM) monitoring.
In the context of technology integration, JD Cloud cooperated with a leading consumer finance company to carry out the best practices of cloud native and full-link tracking in the field of consumer finance. The consumer finance company was a licensed consumer financial institution with over 100 million registered users of its inclusive finance APP. Its backend was supported by major business systems such as risk control and intelligent customer service. Its frontend involved highly active users and heavy traffic, while its APP server and backend were associated with a large number of various business systems and complex scenarios, bringing heavy workload to the entire system operation and technical operation and maintenance team.
In any organization, monitoring should be based on a comprehensive, three-dimensional and systematic platform that requires the collaboration of multiple monitoring tools. In the entire monitoring system, the SGM full-link monitoring system is designed to monitor middle and upper-layer services, including application-level performance, service call relationship, and traffic. It is mainly characterized by service-oriented APIs and methods, and can be extended in terms of multi-dimensional business monitoring based on method monitoring. It also needs to cooperate with the underlying system-level monitoring, such as basic host monitoring, network monitoring, database monitoring (focusing on physical resources and database management), log monitoring system and other components, to combine coarse-grained monitoring with fine-grained monitoring, and organize monitored objects from top to bottom. Many users failed to apply the SGM products in a satisfactory manner, which often resulted in blind spots in monitoring. However, a consumer finance company has built a set of FASTX basic monitoring system that integrated the monitoring and alarm modules of the basic network, host, and device layers, and also built a full-link monitoring system based on the secondary development of the open-sourced framework Pinpoint, realizing the link monitoring at application level. However, due to the large performance loss of Pinpoint, the narrow monitoring range, the coarse monitoring granularity, the inability to flexibly start and stop monitoring items, and the lack of rich monitoring indicators and business monitoring systems, the results of pinpoint application monitoring were not very satisfactory.
Step 1: Integrate the management and control for consistent experience
The consumer finance company had independent alarm channel management, as well as management systems such as the basic information platform NCMDB and AD domain control for users/applications/devices. Therefore, the new products should be integrated into this environment. The authentication module and alarm module of SGM are pluggable, which can be connected by OPEN API to realize the in-depth coordination of user management and authentication system, alarm system and SGM products, narrow the gap between systems, and form a unified use environment. By lowering the access threshold for the customer, the basic user and alarms were integrated into the existing technical system to ensure a consistent user experience.
Step 2: Access the product in batches with quick effect
Considering the numerous internal applications of the consumer finance company, we decided to access the product in hierarchy and batches according to the characteristics of the application technology framework. The business application codes of SGM have not been invaded or transformed. So the product features simple access and is adaptable to common open-sourced technical framework. After consideration, we decided to access the product in three batches.
● The first batch mainly involved C-oriented APPs. The backend services were basically applications of the JAVA SpringCloud technology system, the monitoring items were app backend services, which were more sensitive to response time and user experience. Therefore, they are accessed preferentially.
● The second batch mainly involved basic service system, especially Java.
● The third batch mainly involved backend business management large-scale applications, big data applications, including Java and Python. They were launched gradually with the iteration of the systems.
Results:
● The first batch of systems were accessed and production environment was launched within a week.
● 70% of the applications were accessed in a month.
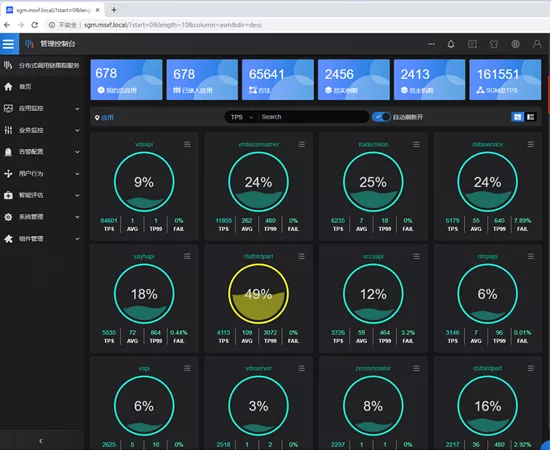
● Most of the applications were accessed in three months. Specifically, a total number of approximate 700 applications were accessed, about 66,000 real-time monitoring methods were implemented, the TPS of flat-peak monitoring reached 16W. The access in the early stage featured desirable time control and low access cost, which achieved the monitoring and management objectives of the company management.
Step 3: Seize the pain points and make breakthrough by leveraging strength
It is difficult to promote new products in the early stage. The rejection of the user and the change of current habits are all obstacles to promotion, especially when there is a self-developed link monitoring system available in the company.SGM products have many features, which should not be given into full play in the early stage. In this regard, in view of the characteristics of the existing pinpoint link monitoring system of a consumer finance company, we recommended an optimal function usage route to the user. We provided two rounds of special trainings to instruct the user to implement a four-layer fine-grained monitoring system of application-service-method-instance, determine the return codes and custom business fields for key methods, build available indicators for monitoring the success rate of business, as well as assisted the user in key alarms and alarm policy.
After being accessed, the SGM product quickly enabled the application-service-method-instance four-layer fine-grained monitoring system for the user without much manual configuration, and instructed the user to figure out the core methods that needed to be monitored, and successfully led these methods to the main line of SGM core functions of invocation query, call link, time-consuming analysis, and log linkage query by observing the indicators for business success rate. This played a crucial role in the early state of the introduction of SGM product. The effective data accumulated with the wide acceptance and adoption of the application drove the healthy operation of the monitoring system, and helped SGM, as a new product, pull through the darkest moment during introduction, laying a solid foundation for further application.
Step 4: Promote comprehensively step by stepAfter the initial promotion in the first stage and being accepted by the user, how can the user, monitoring team, and system operation and maintenance team obtain greater benefits from the same monitoring platform? The two parties negotiated the promotion ideas, and fully tap the value points of monitoring data based on in-depth application, formulated the promotion strategies from the perspective of development, application operation and maintenance, application operation layered indicator monitoring, and large-screen situation awareness, and finalized an implementable plan for comprehensive promotion of SGM.
The user received good revenue and positive feedback during the in-depth use process, and reported several problems to our SGM product team based on its business scenarios and technical characteristics, such as, the conflict of Kafka JMXClient that had not been encountered in the internal scenario of JD, the problem of custom business field invalidation after recycling of Tomcat Request information. This effort helped SGM products grow together with customers and improve the products in more financial scenarios.
In the process of serving internal applications and external customers for a long time, we have summarized several best practice scenarios for distributed link tracking, which give full play to the agile capability of microservices architecture from an omniscient and omnipotent perspective:I. Solutions to R&D Obstacles
1.Typical problem: How to accurately locate a fault?
It is difficult to troubleshoot sudden anomalies in face of frequent business application performance problems and traffic fluctuations; there’s no snapshot related to the on-site environment when the fault occurs, leading to subsequent troubleshooting based on system logs and expertise of team members; there’s no proven, repeatable analytical technique and technical support tool set. In addition, for the technical team of the consumer finance company, which pursues service SLA guarantee capabilities, it is a big challenge to accurately locate the problem and shorten the time for troubleshooting.
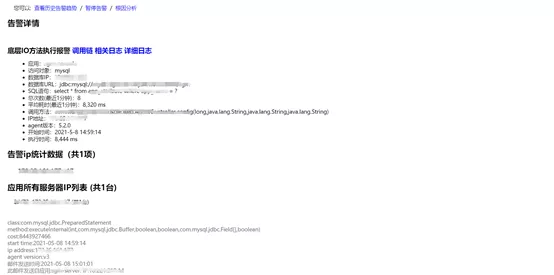
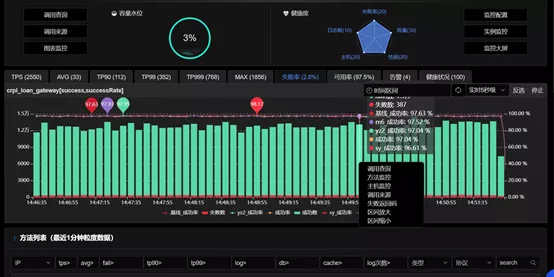
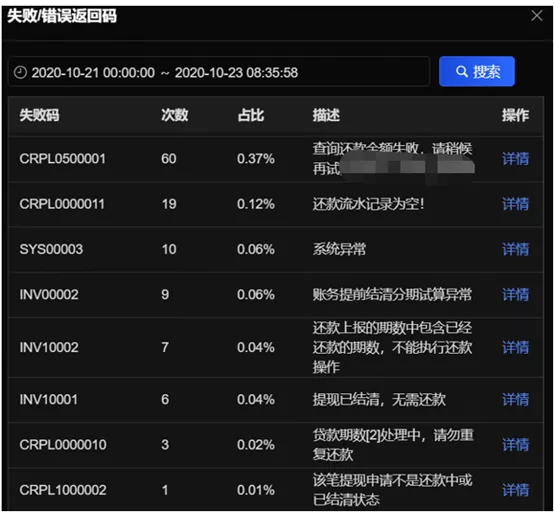
Solution: Thanks to the real-time log collection capability and efficient processing capability of the SGM full-link monitoring system, in the beginning when an exception occurred for an application monitored method, the alarm information was timely pushed to the relevant party of the business application through the built-in alarm module of the SGM, which prompted the elapsed time for application method, average response time, frequency, JVM monitoring, and multi-dimensional TP9XX/AVG/MAX series performance indicators. In addition, the alarm information provided potential accesses to facilitate the troubleshooting by business engineer. A series of troubleshooting tools provided by SGM were connected by the alarm accesses, including call query, time-consuming details, call chain, topology map, performance distribution of topology call chain, JVMGC analysis, network connection, and JVM memory toolbox, making the entire troubleshooting process simple, smooth and effective.
Results: A set of standardized troubleshooting steps and tools were formed through the built-in function modules of the SGM, which were integrated with the active alarm module. A series of troubleshooting tools were aggregated by the SGM to quickly restore the incident scene, which effectively assisted the R&D in accurately locating problems and quickly troubleshooting problems.
2.Typical problem: How to deal with the problem of the underlying IO level?An application system may often encounter underlying IO-level errors during operation, including relational database, NoSQL database, Redis, Logger framework, and MQ framework. Frequent problems are often mixed in log files and can easily be overlooked, thus leading to production incidents.
Solution: We instructed the user on the use of SGM alarm module. SGM has one-stop built-in detection rules and thresholds for underlying IO exceptions, and can provide standard detection and alarm capabilities once being accessed, capable of dealing with the exception in the production system.
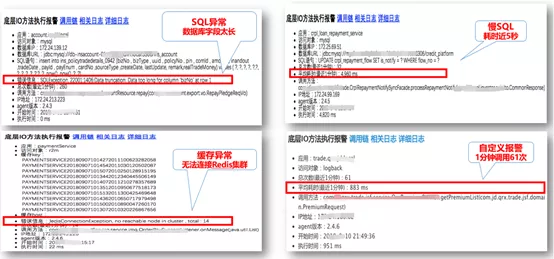
Results: We dealt with the problems related to underlying IO separately, upgraded the alarm level, helped business applications establish a cognitive system for hierarchical monitoring, identified the causes of the problems, optimized the alarm strategy from passive mode to active mode in a timely manner, improved the warning and handling capacity with respect to underlying IO problems, and solved these problems quickly by using SGM troubleshooting toolbox.3.Typical problem: How to analyze the service time?In the microservice architecture system, how to monitor the time-consuming distribution of calls is a challenge. The service cost, together with network cost, the impact of cross-data center delay, network packet loss, server thread pool blocking, service link fuse, traffic limit and other measures, as well as server GC, client GC, constitutes the entire cost of distributed calls. In a consumer finance company, the technical architecture was mainly based on spring cloud microservices. Therefore, the time-consuming distribution of service calls and how to quickly determine the ownership of abnormal services when problems occurred were mostly concerned by the technical team. Solution: Through the cooperation with the underlying host monitoring and SGM link tracking, we provided global-view monitoring of elapsed time for call, and enabled accurate statistics and problem location for the service time in the cross-host communication mode in the microservices era. SGM can provide monitoring at various levels, such as applications, services, methods, and instances. It allows to reverse query the source of each call, track upstream and downstream service status, observe the service performance fluctuation curves, locate the problematic service, and coordinate with the service owner in joint troubleshooting. 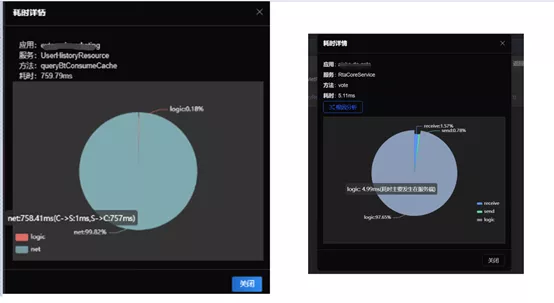
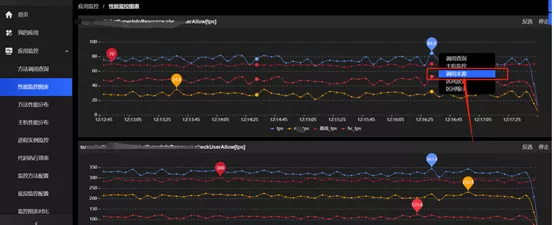
Results: SGM products can help users acquire clear information about the dependency relationship among services, and accurate time-consuming distribution of service call. For the team of consumer finance companies, they can quickly clarify the business dependency, located the problematic service, and quickly troubleshoot problems together with upstream and downstream services in a simple and efficient manner. II. Solutions to Architecture Management
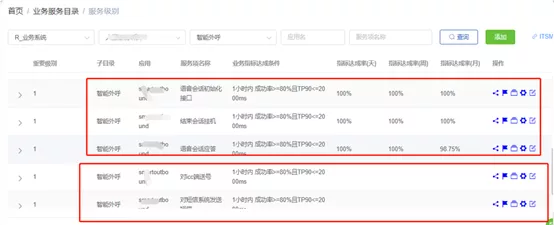
4.Typical problem: How to use active data for service management?With the rapid development of businesses and emergence of new applications, the actual running state of the active service may have deviated from the architecture plan at that time. The conventional practice is service management based on the architecture documents. However, in face of accelerated pace of iteration and frequent changes, how can we quickly discover service dependency problems and carry out service management based on the most realistic active data? This issue is also most concerned by consumer finance companies. Solution: SGM product supports the service management through the monitoring log data based on the logs acquired in real time by the application system. It creates a layered global view through insight into the massive calling full-link information in the application, so as to reveal the real call relationship, call frequency, call intensity and upstream and downstream traffic fluctuation status among services. SGM provides a set of tools such as calling full-link analysis function, hierarchical drill-down, drill-up, calling source analysis, calling topology, topology performance monitoring, and real-time calling topology map, focusing on cracking service bottlenecks and dismantling unreasonable service modules, combining scattered and free services, constantly exploring and adjusting, and timely observing the new model for re-optimization of changed data.Results: The product has been continuously and deeply applied in the internal service management scenario of the consumer finance company, and the technical team has formed an effective management idea and plan through exploration, and developed the SRE business-level indicator evaluation system on the basis of SGM. Based on various monitoring data of SGM product, the system has effectively monitored the service status and business indicators of each application, which satisfied the requirements of the company management for improving the technical visibility of data application.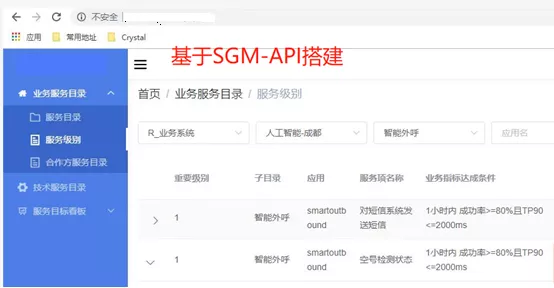
5.Typical problem: How to evaluate availability and failure rate?How to evaluate application health status, business success rate, and system availability? In a consumer finance company, most of internal applications judged whether the business was normal by the status code of the request. However, the coarse granularity made it possible to accurately identify the method level, and the understanding of business health identification methods differed among applications. Therefore, maintaining consistency and shielding the difference had become an important issue of architecture management. Solution: This issue can be solved by building a unified and credible monitoring system for availability and failure rate (success rate). SGM product can provide a set of conventional identification code specifications by default to mark the health of monitored objects, and also provided an access for business custom rules. SGM has a global, application-level, and method-level three-layer identification code mechanism. By monitoring the active call chain of the application in real time, it can mine the sudden exception information during the execution process, and form the real-time availability monitoring results of the system. Based on a unified result tags, it can shield the differences between the return codes of specific methods, and build an application success rate detection system in five dimensions – method, service, application, instance and data center – in combination with availability indicators by leveraging the dynamic monitoring results of method-level return codes. In this way, the technical team of the consumer finance company can objectively evaluate the real-time health status of the application through the success rate and availability rate, and monitor and observe whether the business operation meets the expected goals through the classification of return codes. In addition to the failure rate and availability indicators, the data of fluctuations in performance indicators, logs and capacity data were added in the SGM product to build a multi-dimensional, application-oriented comprehensive health evaluation indicator system.Results: In the practice of a consumer finance company, the understanding of application health and the definition of monitored methods and return codes of all users has evolved from confusion, acceptance management to clear and orderly understanding. An insight into the essence of method monitoring and return code identification is a good basis for SGM products to be widely implemented in consumer finance companies.
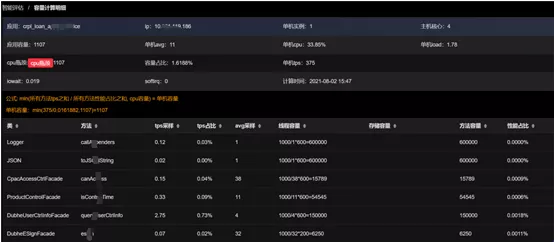
6.Typical problem: How to evaluate business capacity?The consumer finance company featured greatly fluctuated call volume of businesses, large difference in the energy amount among businesses, and had no found the reliable starting point and data supporting point for business capacity evaluation. The contradiction between balancing resource utilization and ensuring service availability and user experience has often troubled the technical team.Solution: The real-time capacity evaluation function and hydrograph of SGM product were the best means to describe the availability of application resources and services. While collecting application monitoring logs, the SGM background also evaluated the real-time capacity of applications through special calculation methods. The capacity evaluation accumulated layer by layer from method to service to application, and finally fed back the real-time capacity changes through the hydrograph.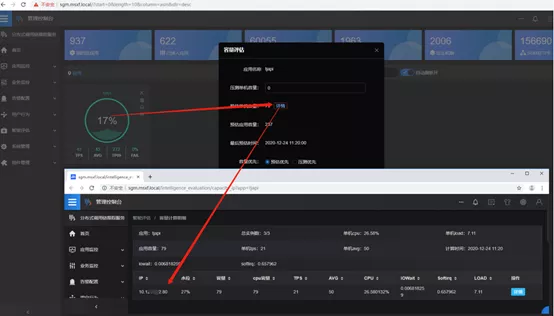
Results: The change of application capacity is an issue concerned by architecture team, and also by the monitoring personnel on the application side in particular. On the one hand, they need to pay attention to the response time of application running to ensure user experience; on the other hand, they need to take into account the utilization rate of resources and control costs. Through the real-time capacity evaluation module, the SGM product has effectively assisted the team of the consumer finance company in this regard, achieving a balance between ensuring user experience and resource utilization, and was recognized by users.III. Solutions to Application OM
7.Typical problem: How to make effective alarms?The monitoring personnel are frequently troubled by alarm exceptions, repetitive alarm information, or valid information mixed up with repetitive information.
Solution: In the case of the active monitoring and intelligent release of massive APIs based on the SGM alarm module, there would be heavy workload for separate configuration to ensure the comprehensive and accurate alarm of the application. The SGM product can provide a variety of options. Baseline-based alarms are a feature of the SGM alarm module. The SGM provides alarms for applications in three dimensions: global alarms, application alarms, and method alarms. It can provide specific alarm capabilities for business monitoring graph based on business, generally accommodating alarm demands of different groups. The SGM alarm module is capable of root cause analysis. It can intelligently match and correlate alarm information that fluctuates continuously, merge suspected root causes, and get root cause alarms and push them to application-related personnel.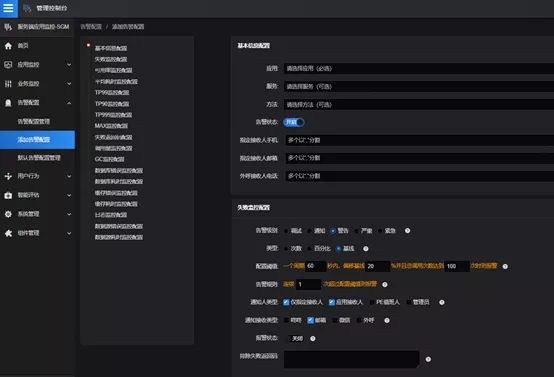
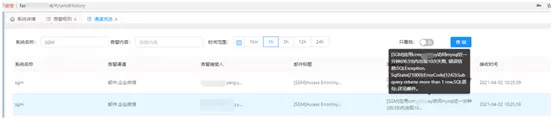
Results: In the application scenario of the consumer finance company, a frequently used functional section was adopted as the alarm module. Many daily production failures and problem solving processes were triggered based on alarms, quickly located and solved in a timely manner through the SGM troubleshooting toolbox (call query, call source, call link, time-consuming details, drill-down call chain, drill-up call chain, performance indicator fluctuation chart, associated MDC log linkage, extraction of custom business fields).
8.Typical problem: How to translate monitoring data into business language?
In the early stage of monitoring, the technical team of a consumer finance company tried to collect monitoring data based on the open-sourced pinpoint. Due to the limitation of pinpoint’s own architecture and the lack of rich chart customization and visual display modules, the entire monitoring data did not play its due role. With the rapid business development, the overall C-end user traffic continued to rise, bringing great pressure to the technical team. The continuously available service assurance requires the support of all-round, multi-perspective observable data and the display of visual monitoring chartsSolution: A basic monitoring situational awareness environment can be quickly built in the application system through the built-in fixed charts of SGM, including modules such as call volume, performance TP, AVG, MAX indicator monitoring chart, failure rate, availability rate, monitoring radar chart, and application market. Further, the application large-screen monitoring, classified monitoring view, process monitoring, loop monitoring, ratio monitoring, and key method multidimensional performance indicator monitoring can be customized according to the characteristics of the application products.
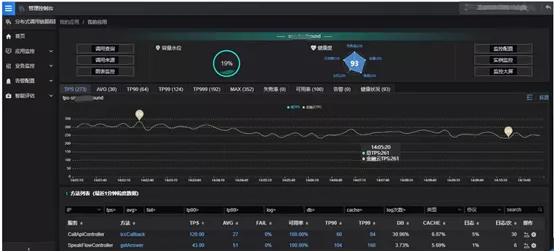
Results: Continuous mining of data application scenarios is a symbol of in-depth use of products by users. In a consumer finance company, it not only used the alarm module to address various abnormal scenarios and fault diagnosis of the application, but also deeply used the various data produced by SGM for visual data display and reports customization. Moreover, its technical team has developed several monitoring and disposal systems subordinated to SRE technical system through SGM OpenAPI, exerting huge business value by using SGM product monitoring data in depth. Benefited from a set of basic monitoring system built by the consumer finance company in the early stage and the process of exploring the link monitoring system based on Pinpoint model, its team had a deep understanding of the service link monitoring system, so in the promotion process of SGM products, many overlapping points were opened, and then superimposed with the strength of SGM products, which really driving the business growth.
As a consumer finance company with pure Internet technology background, it tended to adopt the Internet sensitive architecture for the technology stacks and its own digital technology demands were relatively mature. This is a typical case of the best practices of SGM distributed full-link tracking. SGM is an important product in JD Cloud’s distributed financial middle-office matrix, which has been tested in both internal and external scenarios. Compared with open-sourced products and industry commercial products, it has a profound understanding of financial scenarios. In the future, we will further share the implementation principles and technical highlights of SGM link tracking, and explore the application progress of observability in more cloud-native scenarios, such as servicemesh and other new technologies. 


